Other Humanities Subjects Lost Majors Too, but History Lost More
After seeing the surprisingly steep drop in the number of history bachelors degrees awarded in the academic year ending in 2014 (post and viz here), I wanted to compare history to other humanities and social science subjects. After carving out some time during the holidays, I did, and found that yes, these subjects also lost students. But the loss experienced by the history discipline was still exceptional.
The first chart below shows the percent change in the number of graduates between AY 2013 and 2014 for several majors. All of these humanities and social science subjects lost students (and I threw in psychology and communication/ media studies for comparison). History’s 9 percent drop, however, is more than twice the average drop for humanities/social science subjects.
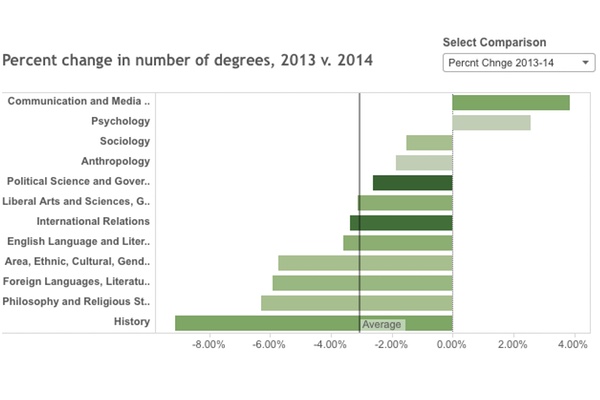
Since the earning potential of bachelor’s degrees often comes up in discussions of the relative popularity of majors, I colored the bars according to the median salary of degree holders age 25-59 by subject (this data came from Georgetown University’s Center on Education and the Workforce). No real pattern emerged. History grads earn more than psychology grads, but the number of psych degrees went up. History grads earn a bit more than philosophy grads and foreign language grads, but these subjects did not drop as much, at least not this year.
Academic year 2014 is only one year, and I wanted to include broader trends. These are available in the dropdown menu “Select Comparison.” The item “Percent change, 5 year groups” shows the percent difference between the total number of graduates from 2005-2009 and the total from 2009-2014. Using these chunks helps remove year-to-year swings, and indeed, here we see a percent change for history that is above zero. But not by much, and especially not by much in comparison to other subjects.
“Change in share 2008 v. 2014” compares the percentage of bachelors degrees that were history degrees (or psych degrees, etc.) in 2008 to the percentage in 2014. History went from accounting for 2.29% of all bachelors degrees in 2008 to 1.72% in 2014. That’s a difference of less than one percentage point, but it means a loss of about 3,500 students. Here, history is not the worst-performing subject, but it still compares unfavorably to the average. ...