How goes the recovery? Not well, it seems. Indeed, according to the most recent official estimates, it is a anemic, at best.
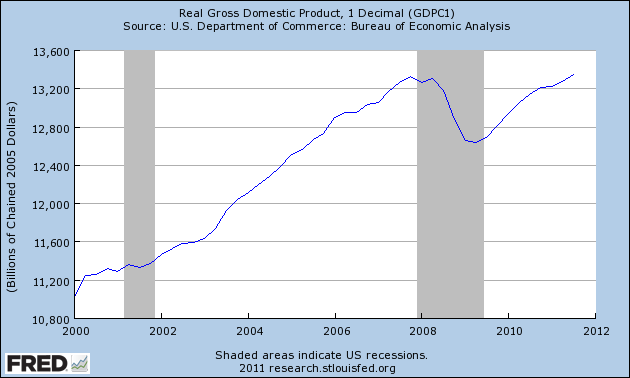
As the chart shows, real GDP has recovered its losses during the recent contraction and is now running at about the same rate as it was at its pre-recession peak in late 2007. So, the rate at which the U.S. economy produces total output has gained nothing during the past four years, and its present rate of growth, even if it continues, is too slow to bring back into employment many of the would-be workers now without work, including a disturbing number who have been without employment for years.
As I have discussed previously, consumption spending has recovered fully, and government spending has reached new highs. Investment spending, however, remains depressed despite some recent pickup. Real gross private domestic investment has increased from its recession trough of about $1.4 trillion per annum to a current annual rate of about $1.8 trillion, as the chart shows. However, it remains far below its prerecession peak of almost $2.3 trillion. Moreover, about $1.5 trillion of the current gross spending rate does nothing but compensate for depreciation—obsolescence and wear-and-tear—of the current capital stock, leaving only about $0.3 trillion per annum as real net private domestic investment.
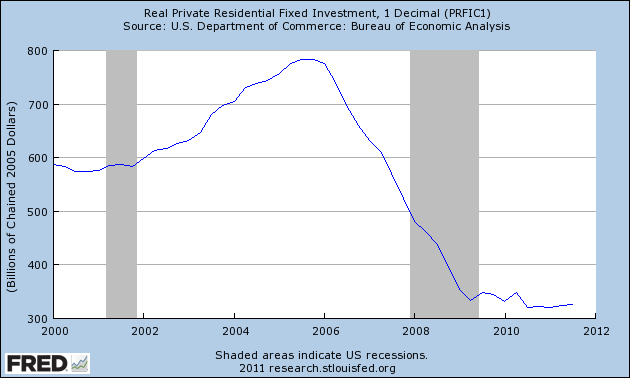
We all understand, of course, that the housing boom and bust have left the country with a great deal of residential housing that cannot be sold without much greater reductions in the already-greatly-reduced asking prices. Therefore, little incentive exists for new investment in residential housing, and so this type of investment is currently running at only about 40 percent of its pre-recession peak rate, as the chart shows, and it has shown no substantial sign whatever of recovery.
However, the residential housing bust is scarcely the whole story of the presently depressed investment spending. As the chart shows, real private nonresidential fixed investment (a much larger component of total investment, even during the housing boom), despite rapid recovery from its recent trough in late 2009, remains well below—about 7 percent below—its prerecession peak rate.
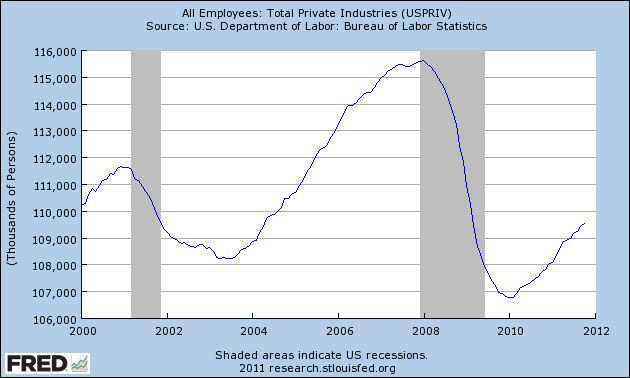
The rate of unemployment of labor (U-3) has remained stuck in the 9-10 percent range for roughly two and a half years. Given the difficulties of interpretation associated with the labor department’s measures of unemployment, we can see with more assurance what has been happening in the labor market by looking instead at employment. Here we see, as the chart shows, that although almost 3 million persons have been added to the employment rolls during the past two years, approximately six million fewer persons are employed in private industries now than were employed at the prerecession peak. Moreover, fewer persons are privately employed now than were employed in 2000—eleven years ago, when the population was substantially smaller.
In sum, although we see some indications that recovery has occurred, the labor market remains far from a full recovery, as does the volume of net private investment. The former is unlikely to recover fully until the latter begins to grow rapidly. However, given the present clouded prospects for the security of investors’ private property rights, with regime uncertainty hovering over public policy in many critical regards, the likelihood of a strong investment boom must be considered extremely slight.


